Back of the Envelope Machine Learning
A demo for thinking about how to use ML to steer decision making.

A demo for thinking about how to use ML to steer decision making.
One approach to problem-solving is to use a program to find the optimized solution. This applies broadly. For example, your problem might be finding the lowest cost location to build a distribution center (DC), finding the right people to add to your team/company, or determining how to get to the local Target. When systems create … [Read more…]
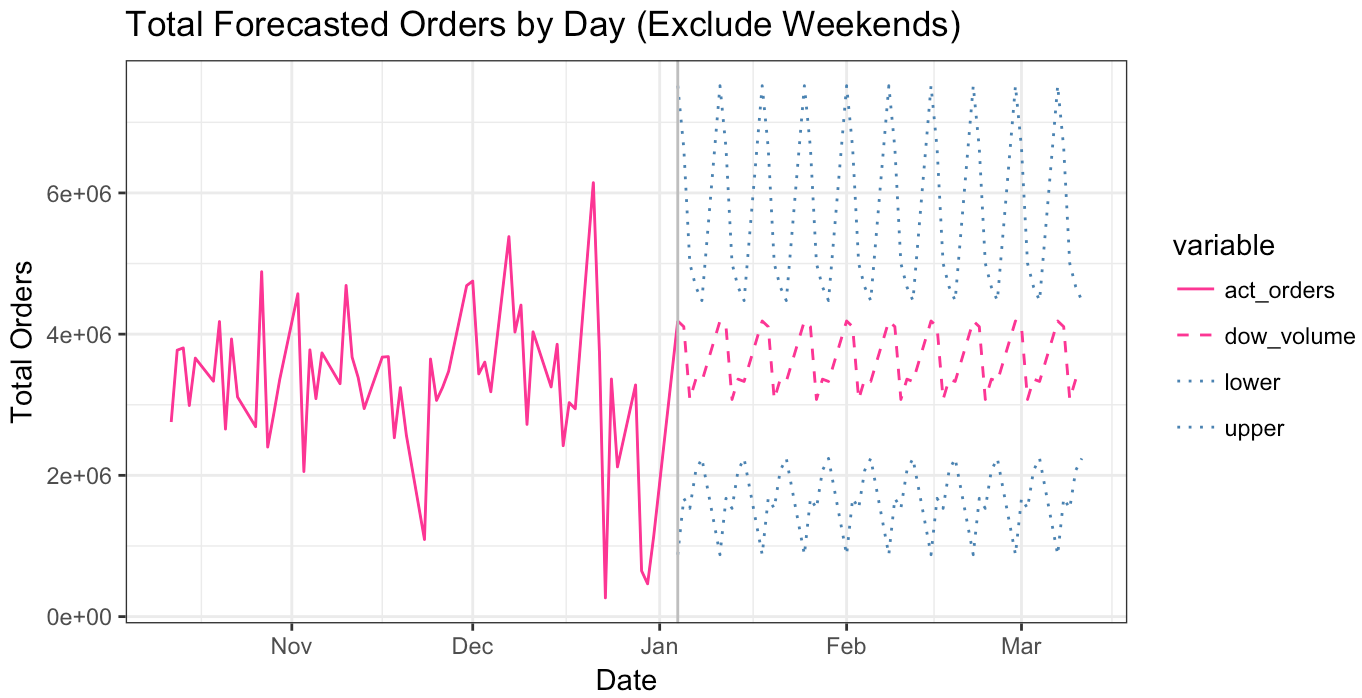
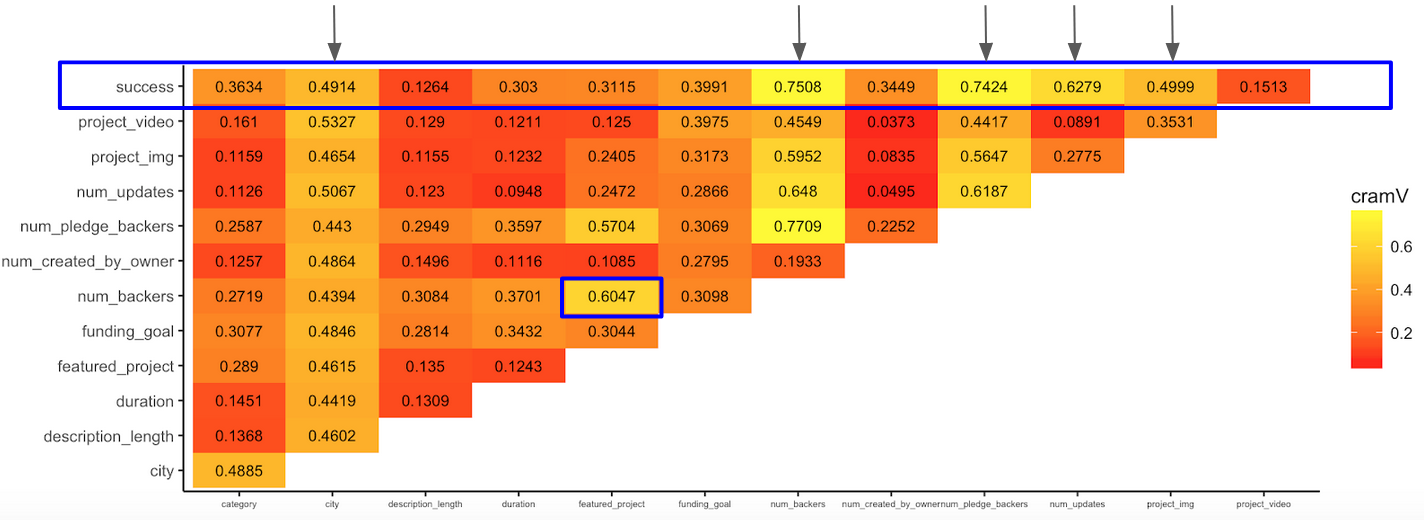
It’s hard to beat the value-add of a good forecast in supply chain. Supply chains are long – thousands of miles with dozens of participants. Without a decent forecast you’ll end up with an abundance of waste in some way, shape, or form. We forecast for manufacturing products, securing transportation capacity, obtaining & using warehouse … [Read more…]
At first sight, the Sankey diagram appeared to me as a very cool data visualization but impractical for discovering impactful insights. That’s probably because I didn’t know how to build them quickly to explore my own data. Over the past few weeks, I’ve been able to take the time to build some of these charts … [Read more…]
When working on my project to find the optimal running route given a starting/ending location and mileage, I needed to build a routing engine so I could make numerous calls without hitting an API limit. Below is my note os how I set that up OSRM on MacBook with python.To figure out the distance between … [Read more…]
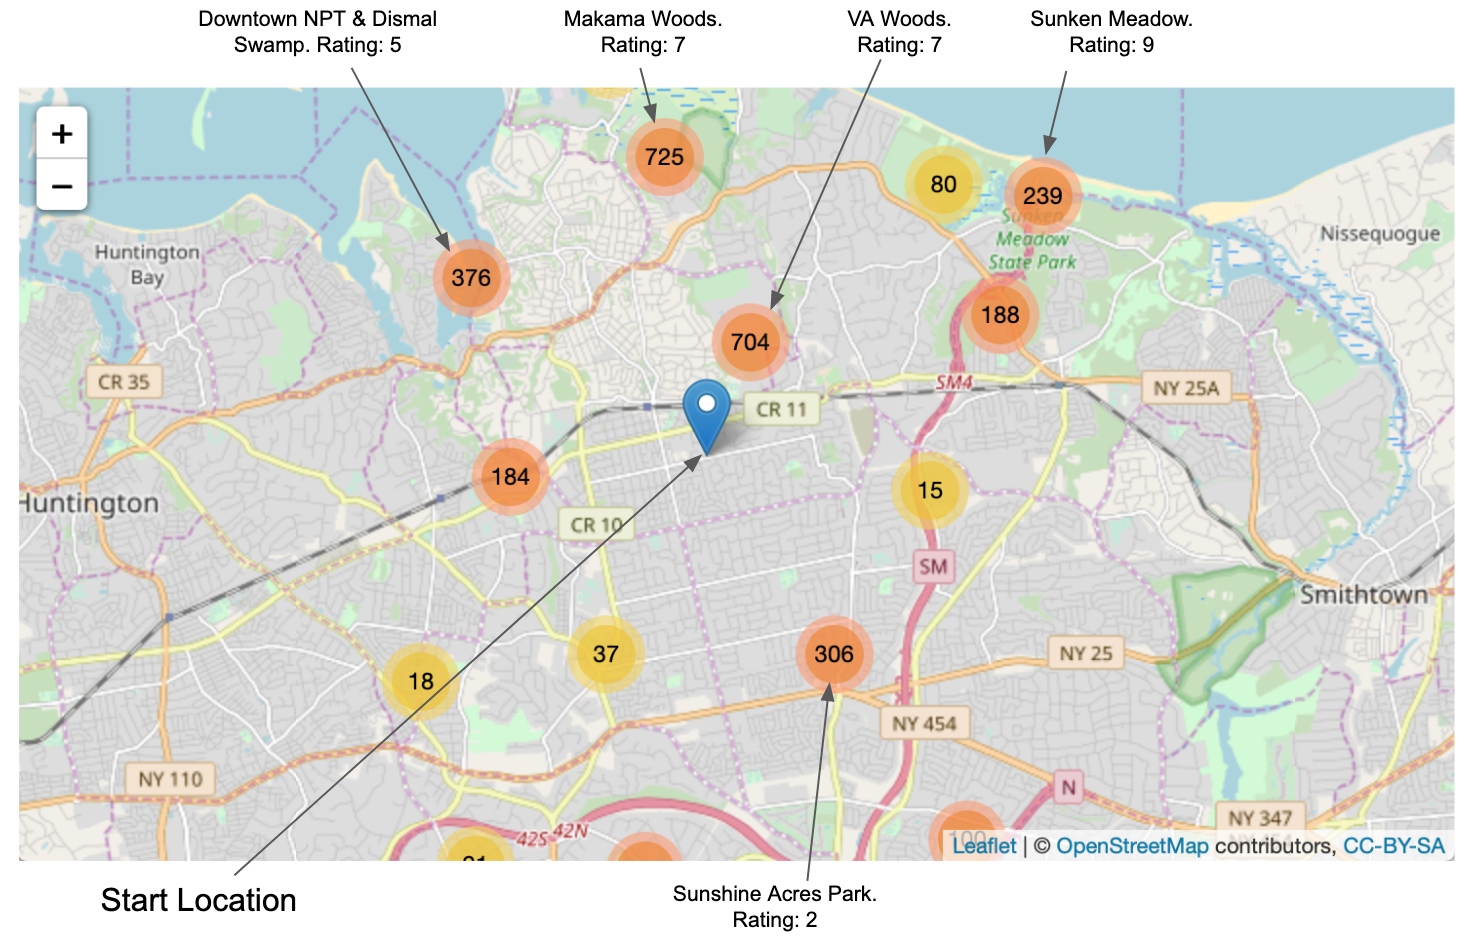
Occasionally, I need a map. I’m not talking about a beautiful, polished work of art. I just need something that gives me some spacial context and that will be acceptable in a customer presentation. Most frequently I need to see points on a map… sometimes lots of them.If you Google ‘plot points on a map’ … [Read more…]
Last week, I finished the 6 course Data Analyst Nanodegree offered by Sabastian Thrun’s Udacity Inc. Even with an above average number of academic credentials behind me, I will venture to say that this was the best educational endeavor I’ve been through yet. When I worked through my undergrad and graduate degrees in economics, I … [Read more…]
The state of Florida, every four years, is a definitive swing state in the US Presidential election. Since 1996 – 5 election cycles ago – the candidate that captured Florida’s electoral votes became the next US President. Assuming a strong correlation between campaign contributions and election results and having perfect hindsight of knowing the 2012 Presidential election … [Read more…]
Encountered what I think is a pretty common excel problem at work today. A colleague showed me an excel spreadsheet that was reading warehouse locations as scientific notation. For example, location 05E03 was being read into excel as 5.00E+03 and if you tried to edit the cell or convert it to text, you’d be given … [Read more…]
Based on the infamous mtcars dataset, I used a stepwise selection process to generate a predictive model of fuel economy for 1974 automobiles*. My entire process was done primarily in R and can be found here on rPubs. In short, the model uses a car’s weight and 1/4-mile time to predict mpg’s. At the same … [Read more…]