Historically, many people determined their geographic location based on job proximity. Personally, in the past 10 years my wife and I moved from San Francisco to New Jersey to Boston and to Minneapolis in pursuit of new job opportunities. While many jobs will remain locale-based, many will not. In his new book Masters of Scale, Reid Hoffman says “if you want a wide range of perspectives [i.e. cognitive diversity], don’t allow your company to be fenced in, geographically.” Smart companies will embrace remote teams (if and where they can), increasing the opportunity to determine your geographic location based on factors other than job proximity.
Sometimes, too many choices creates confusion and paralysis. That’s the paradox of choice. When it comes to figuring out where to live, the number of options is endless if not constrained by job proximity. School quality, house prices, taxes, proximity to nature & amenities & breweries… social networks. Data can help narrow the scope, correlate geographic locations with your values, and increase the probability of a good outcome if you relocate.
Starting assumption: your family/friends network is concentrated across Long Island & Westchester, NY… through Connecticut and up into Boston. You want to be in the middle of that in order to be close, but not too close, to people you love. So, tell me about Connecticut…
## House Prices
A go-to starting data point is housing prices. Taking median single family home (2019) values and adjusting for town mill rates, the first truth about Connecticut becomes clear; the southwest region of the state is in a different cost-of-living game from the rest of the state.
## Trail Systems
I love running and biking, both competitively and with my kids. I’ll gravitate towards areas with more trail systems. Luckily, OpenStreetMap data is tagged with detailed information, including footways and cycleways. From the center of each town in CT, I counted the number of nodes in OpenStreetMap data tagged as either footway or cycleway. It’s clear that there are more running and cycling paths west of New Haven and moving north up to west of Hartford.


## School Outcomes
Connecticut’s Department of Education captures awesome data on school outcomes sliced and diced in all sorts of ways. I looked at the aggregate outcome metric. Since I have two small kids… good schools are non-negotiable. There is considerably more diversity across the state with this metric. The “Lyme” area looks great. But, perhaps, this metric shows me more about where we want to avoid rather than where we want to be…

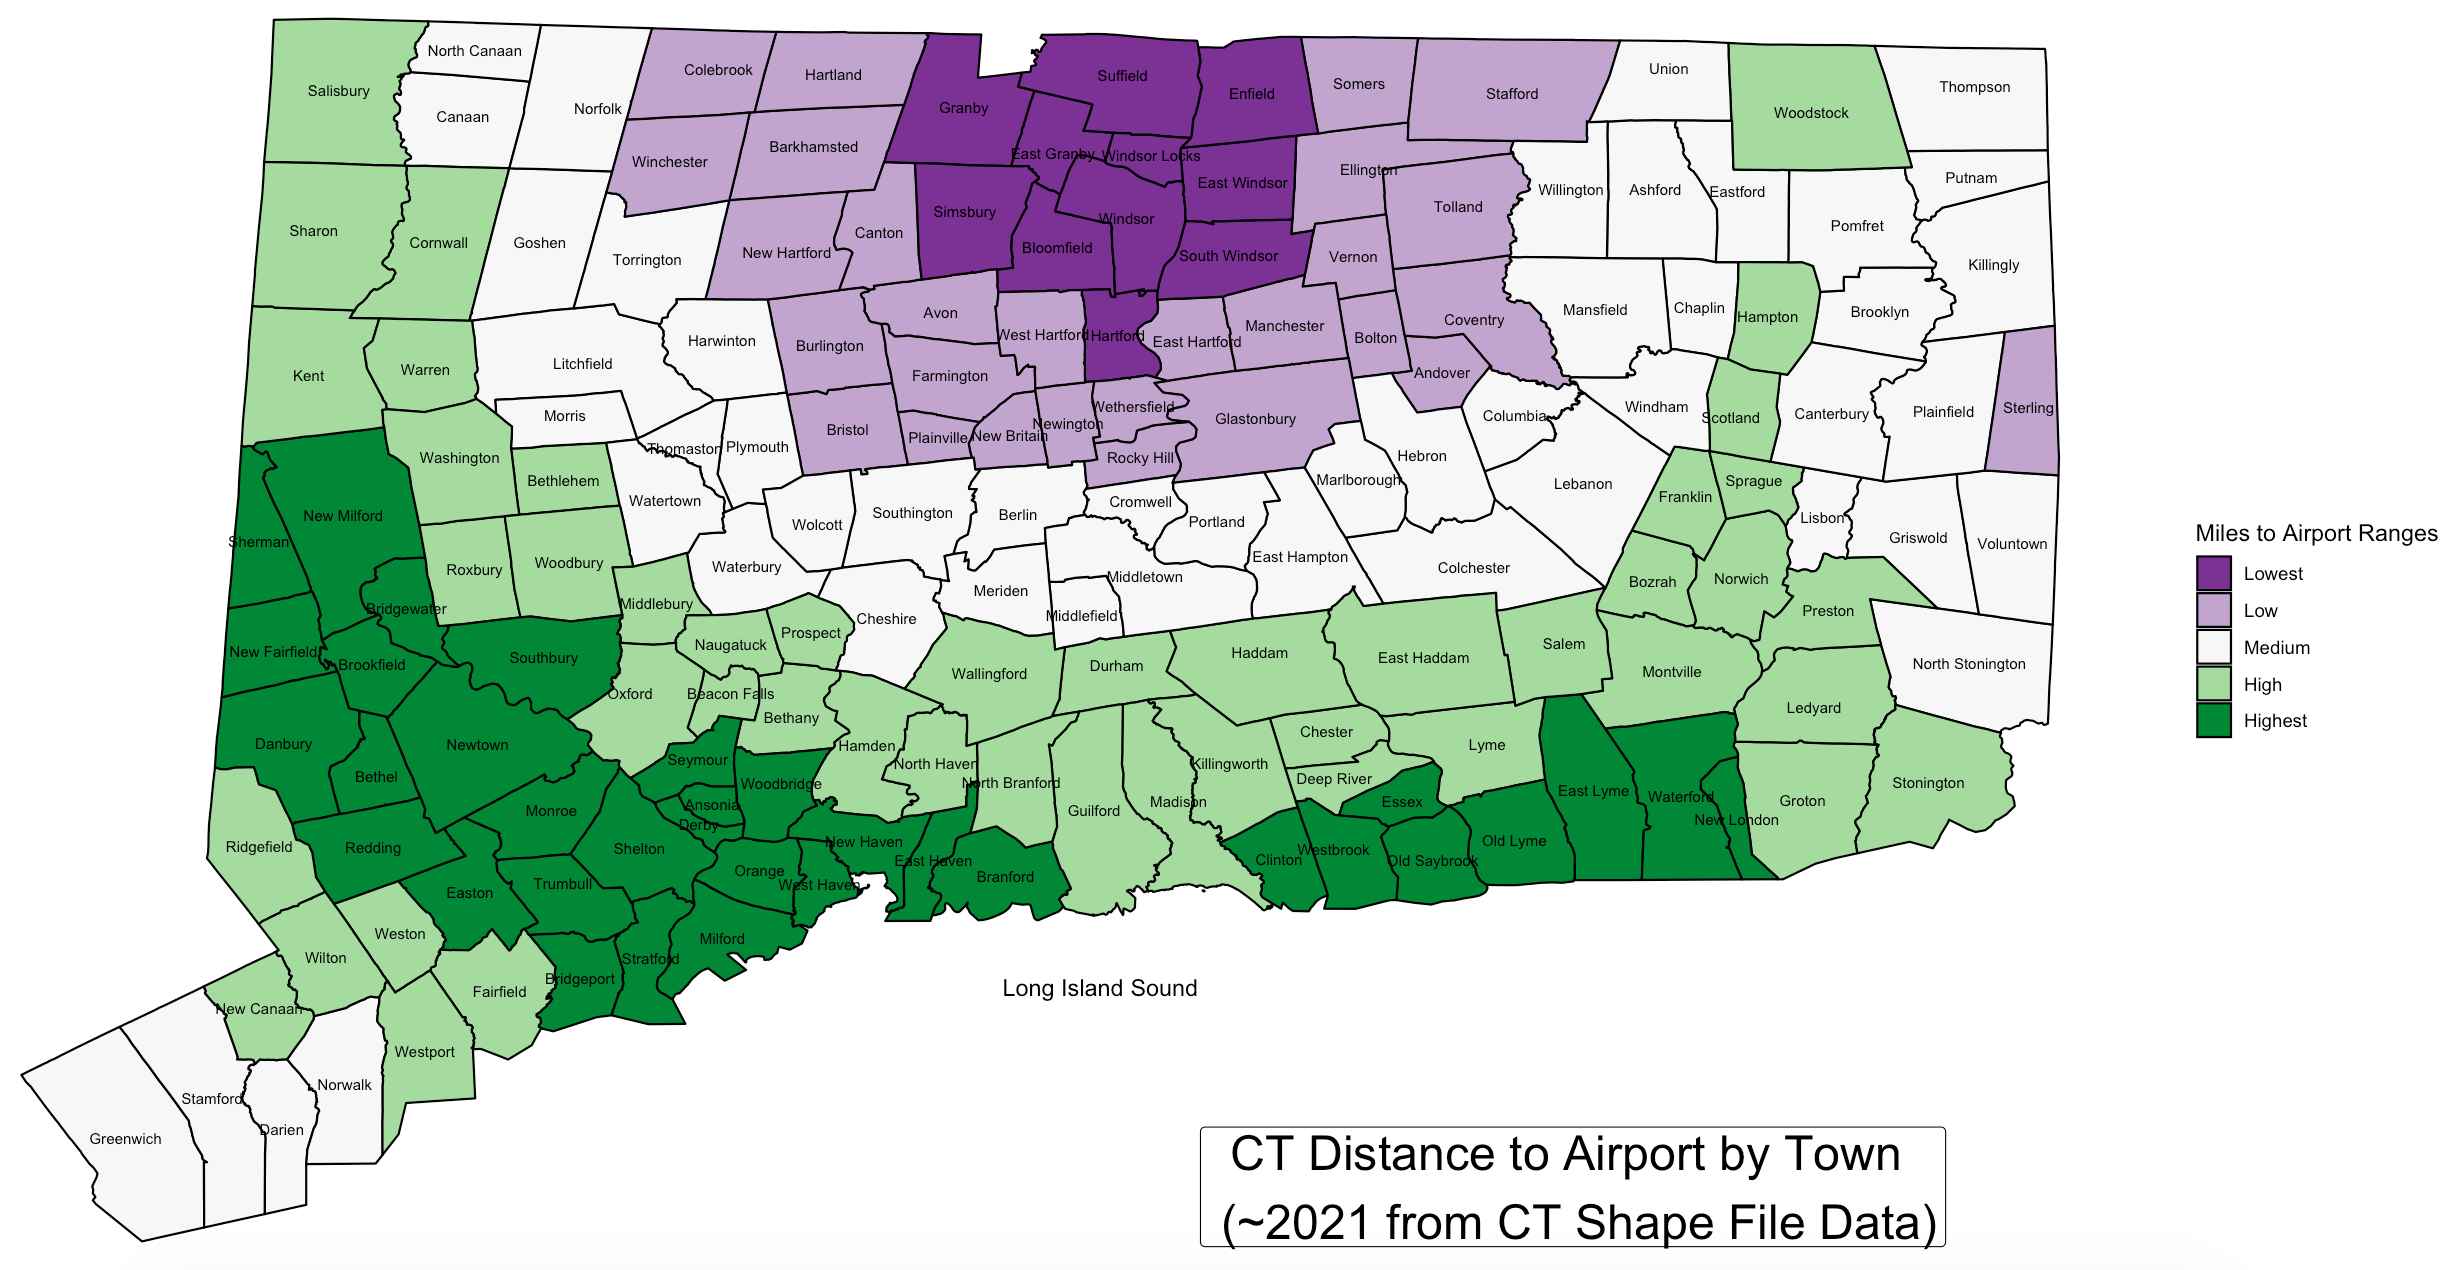
Remote work is great, but I have no illusion that it won’t require intermittent travel. As such, I think proximity to a major airport is prudent to consider. The below visual uses ‘as-the-crow-flies’ distance from each towns’ center to the nearest major airport (LGA, JFK in NY, Bradley in CT, or TF Greene in RI).

Each of these metrics by themselves are interesting, but unhelpful. So, I created a compound rating that’s a blend of normalized metrics for school outcome + trail systems – house prices – distance to airport. With this equation, higher is better. I weighed them like so; 35%, 35%, 20%, 10%. Looks like Jess and I have our regions: northwest of New Haven and either south or west of Hartford.

Here is what I love about data analyses like this: there is no right answer. There’s a tremendous amount of judgment needed to put these metrics into action because even though we have guidance there still remains a lot of questions. Will mill rates rise in certain towns? Will school outcomes remain stable? Will my values (i.e. weightings for the aggregate metric) be consistent into the next few years? Should I also include restaurants or hospitals or age of population? Maybe. Do I feel good about my interactions with people in the town?
Even with more information, there’s still lots of uncertainty. But that’s ok. Obtaining and examining this data – especially the harder to obtain stuff like trail counts or miles to airports – is good due diligence. As long as each data point moves me marginally closer to better information, that increases the probability of a good outcome.
Note: if you are interested in the methodology (data gathering, cleaning, analysis, and visualizations), I created an Rmarkdown file here.


Comments are closed, but trackbacks and pingbacks are open.