
As a business development manager (BDM) it’s good to be a data science aspirant, especially when your customer relationship management (CRM) platform doesn’t have the type of out of the box analytics that you need to answer questions about your sales processes. My data science education has enabled me to write my own code and ultimately to better understand my organizations data, solve complex problems, and better forecast future opportunities.
The below analysis stems from a question I asked when I first started as a BDM – how quickly do we move opportunities through each stage of our sales pipeline? As a proxy for this, I calculate what I call average stage duration for individual stages and average pipeline duration for all stages combined. For example, if I have 3 opportunities in the Development stage today and they have been in Development for 3, 20, and 30 days…then my average stage duration would be (3+20+30)/3 = 18 days. If nothing changed tomorrow, then that metric would increase to (4+21+30)/3 = 19 days. If this number is traditionally closer to 8 days, I’ll be trying to figure out why our Development velocity is twice as long as normal. Although Salesforce doesn’t give you this report directly, some data manipulation and programming knowledge can get your there.
I started the process in Salesforce with a canned report called “Opportunity History”. To that report I then added several fields — ‘Created Date’, ‘Stage Change’, and ‘Stage Duration’ — and exported the data into as csv (data for this analysis sourced on April 9, 2016). Now, some phases of this analysis can definitely be done in excel… but I found it much easier to write some python code and create an ipython notebook. Here is a tutorial ipython notebook if you want to replicate this analysis with your own data: https://github.com/FrankRuns/salesforce/blob/master/apd_tutorial.ipynb
The initial data cleaning included:
- Stripping out all of the deals from our ‘John Doe ‘ sales reps because their products (transportation) have a fundamentally different sales process than the rest of the team (warehousing and distribution – which I am particularly interested in).
- Sub-setting only rows where Stage Change == True thereby dropping irrelevant change rows such as adjusting the total amount (important, yes, but not for the purpose of this analysis).
- Creating some additional integer fields to help identify the current stage if multiple entries were made on the same day which I call ‘From_Stage_Label’, ‘To_Stage_Label’, and ‘variance’.
- Converting all date fields from string objects to date objects.
It should be noted that the stages of our sales pipeline are Exploratory, Development, Proposal, Negotiation, and Implementation. If you are trying to replicate this analysis, you’ll need to substitute in the stage names that you use in your CRM. So, next. I used a nested ‘for loop’ to create a data set for each day since February 2, 2011 up to April 9, 2016 and calculated the average (mean) number of days in each stage. I use mean rather than median because I want the average pipeline duration to feel the impact of outlier deals. The bottom of the data set (last 5 observations in the data set) looks like this:
| Date | Exploratory | Development | Proposal | Negotiation | Implementation | APD |
|---|---|---|---|---|---|---|
| 2016-04-08 | 142.1 | 28.1 | 67.4 | 28.8 | 45 | 311.3 |
| 2016-04-09 | 143.1 | 29.1 | 68.4 | 29.8 | 46 | 316.3 |
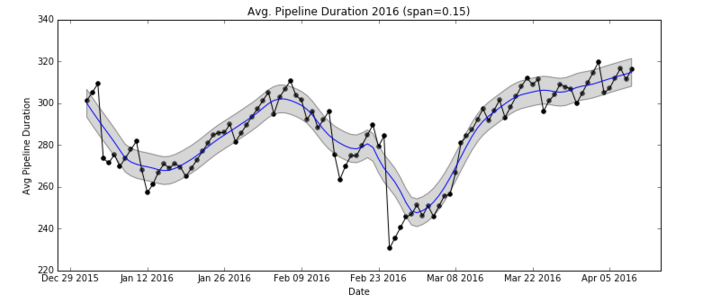
The table above shows that on 4/09/2016 opportunities that were in the Proposal stage had been in that stage an average of 68 days. I define the average pipeline duration as the sum of each average stage duration by day. Continuing with the same example, the average pipeline duration for 4/09/2016 would be 143 + 29 + 68 + 29 + 46 = 315 days or 10.5 months. Our typical average pipeline duration since 2011 is 13.8 months. For each of the six years of data 2011 – 2016, our typical average duration was 11.3 months, 12.0 months, 14.6 months, 17.6 months, 14.2 months, and 9.5 months thus far in 2016. Since we derived a time series data set, we can observe the trend of average pipeline duration since February 2011. There is no question that 2014 wasn’t a particularly good year for pipeline velocity, but we began moving things more swiftly through the pipeline in 2015. However, this improvement seemed to stall out in 2016. Furthermore, if we zoom in and look at the trend line for only 2016 we can see things moving in the wrong direction.

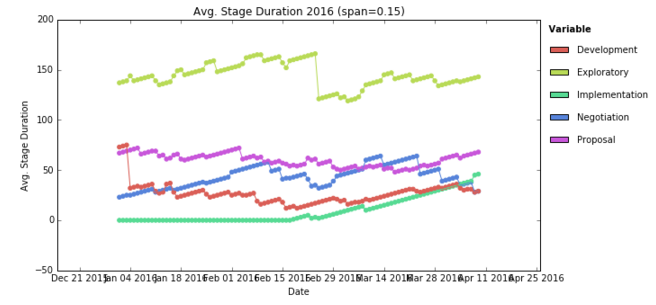
In the last plot, we can see that the Exploratory and Implementation stages are having the biggest negative impact on average pipeline duration over the past several weeks, while Development and Proposal seems to also be on an upward trend.
At this point, it’s important to point out two caveats. First, I make a huge (and I know for a fact incorrect) assumption that the way the team used the CRM 3 and 5 years ago is similar to how it’s used today. I know that over the past 1.5 years we’ve become much better regimented about keeping the CRM accurate and up to date than in the past. This means lots of stuff may have happened before, but we don’t have an accurate (or any) record of it. Regardless, I will continue with this in mind. Second, average pipeline duration can help you monitor relative efficiency in your pipeline over time, but it should not be confused with how much time it takes an opportunity to go from open to close. The reason for the difference is that not all opportunities experience every stage. Some opportunities start in the Development or Proposal stage without ever seeing Exploratory. Some opportunities make it to Development from Exploratory, but before we create a proposal for the customer it is mutually agreed that we are not the right partners and thus the opportunity goes from Development to Closed. Other opportunities go from Proposal to Close without ever seeing Negotiation or Implementation. An analysis of open to close intervals is a topic for another time.
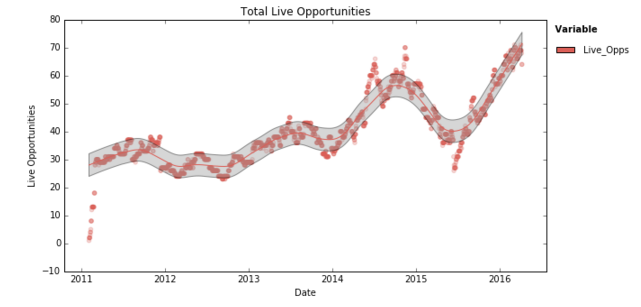
Back to average pipeline duration – why has it begun increasing in 2016 and is it a problem? Comparing the same time period year over year between 2015 and 2016, we find that the ‘win rate’ – which is deals won / deals closed – by count was 11.4% in 2015 compared to 8.8% in 2016. By dollar amount, it was 32% win rate in this same period 2015 and 15% in 2016. I’d say that’s a problem, especially if that gap is going to widen as the year goes on. I will note, however, that there could be data quality issues making this gap more pronounced in either direction – after all this is manually entered data by folks that don’t love data entry. I hypothesize this is the result of the number of deals we have been working relative to our resources. Let’s go back for a second and look at the all deals and determine over time the number of deals we’ve been working on simultaneously. Perhaps the increase in pipeline duration can be explained by constrained resources? The chart below shows a clear as day trend in the number of deals in play simultaneously.
Summary
The average pipeline duration started coming down significantly in 2015 — not surprising since the end of 2014 was sort of a new era for my company in the way it used and valued CRM data. Since the start of 2016, I’ve watched the duration creep up — mainly in the Exploratory & Implementation stages, but also to a lesser extent in the Development & Proposal stages where I believe I have the most influence as BDM. I understand and accept that this metric will be volatile depending upon peak season, time of year, and the diversity of opportunities. After all, from a 12-month run rate perspective… average pipeline duration is trending downward.
However, I am uncomfortable with the fact that our win ratio in the first 4 months of 2016 is significantly lower than for the same period in 2015 (measured by either deal count or deal size). I am uncomfortable with the fact that our team is working on more deals simultaneously on April 9th, 2016 than at any other time in the past 5 years with the same size team.
I believe this is an opportunity to more greatly utilize our CRM data and predictive analytics. A decent model to predict the probability of closing a new opportunity can direct our teams limited resources to the right opportunities simultaneously reducing average pipeline duration and increasing win ratio — closing more deals faster. On top of that, tracking average pipeline duration with revenue growth will allow us to better forecast future revenue and capital requirements. Now, I wonder… how low can we take average pipeline duration and still maintain a healthy win ratio?